Working in Report Studio
To create reports in Report Studio, you must become
familiar with the Report Studio environment.
To work effectively in Report Studio, do the following:
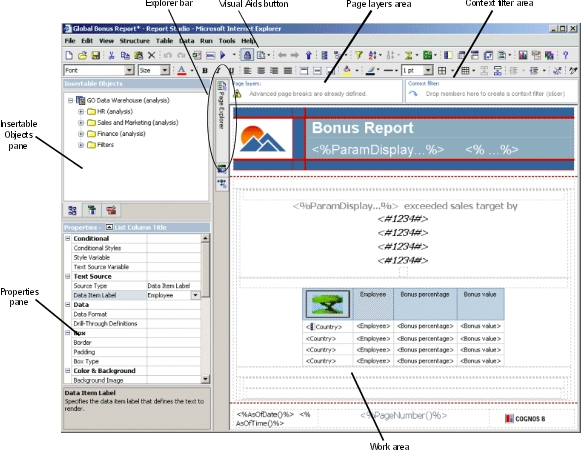
The User Interface
The Report Studio user interface has two panes, an explorer
bar, and a work area to help you create reports.
Insertable Objects Pane
The Insertable Objects pane contains
objects that you can add to a report. You add objects to a report
by dragging them to the work area.
The Insertable Objects pane contains
these tabs:
The Source tab contains
items from the package selected for the report, such as data items
and calculations.
The Data Items tab describes the queries
created in the report.
The Toolbox tab contains a variety of objects
that you can add to the report, such as text and graphics.
Properties Pane
The Properties pane lists the properties
that you can set for an object in a report.
You can obtain additional information about a property by selecting
it and clicking F1. For example, you can view the list of objects
that uses each property.
When you specify a value for a property, press Enter, click another
property, or save the report to ensure that the value is saved.
Tip: View a description of the currently selected property
at the bottom of the pane. From the View menu,
click Property Descriptions.
Explorer Bar
Use the following buttons on the Explorer bar to work
with different parts of a report:
Pause the pointer over the page explorer
button  to go to a specific report page or prompt page.
Tip: You
can also add a new report page or add a prompt page  , as well
as create and modify classes .
, as well
as create and modify classes .
Pause the pointer over the query explorer button  to work with queries .
You
use Query Explorer to create or modify queries and to perform complex
tasks, such as defining union joins and writing SQL statements.
Pause the pointer over the condition explorer button  to work with variables.
You use variables
to define conditions in a report.
Page Layers Area
Use the Page layers area to create
sections, or page breaks, in a report to show values for each member
on a separate page. For example, you can drag Northern
Europe sales territory from the Insertable
Objects pane to the Page layers area.
The report is broken into a separate page for each territory within
northern Europe. Each page’s context appears in the report header.
For more information, see .
Context
Filter Area
When working with dimensional data, use the Context
filter area to filter your report to show values, or
context, only for a specific data item. This technique is also known
as a slicer filter. For example, you can drag Sales Territory from
the Insertable Objects pane to the Context
filter area. When you click a specific territory from
the list, the values in the crosstab change to represent data for
that territory.
For more information, see Filter Values Using Context.
Work
Area
The work area is where you design reports.
Visual Aids Button
The visual aids button  provides
the following options to help you when you are designing reports
in the layout.
provides
the following options to help you when you are designing reports
in the layout.
|
Show Boundary Lines | Shows all boundary lines. |
Force Boundary Lines | Overrides all boundary line settings by
replacing them with default (dotted line) lines. For example, if
you specified a value in the Border property
for an object, the border lines are replaced with dotted lines. |
Show Repeating | Repeats objects when you insert them. For
example, when you insert a data item in a crosstab, the data item appears
in each row or in each column of the crosstab. |
Show Page Header And Footer | Shows the page header and page footer. |
Show Drag & Drop Padding | Shows drag-and-drop zone when the Padding property
for an object is set to 0. If the Padding property
is set to a value that is greater than the minimum padding that
Report Studio uses to show drag-and-drop zones, only the minimum
padding is shown. |
Show Hidden Objects | Shows objects for which the Box
Type property was set to None or
for which the Visible property was set to No. |
Show Sorting | Shows the sorting icon for data items for
which a sort order was specified. |
Show Grouping | Shows the grouping icon for grouped data
items . |
Show Source Type | Shows the icon for the source type of objects,
such as layout calculation. |
Show Data Item Type | Shows the icon for the type of data item,
such as query item, member, or measure . |
Show Drill-through Definitions | Shows data items for which a drill-through
definition was defined as hyperlinks. |
Show Table of Contents Entries | Shows table of contents entries inserted
in the report. |
Show Bookmarks | Shows bookmarks inserted in the report. |
Show Master Detail Relationships | Shows master detail relationships defined in the report. Tip: Pausing
the pointer over the master detail relationship icon shows the relationship. |
Show No Data Contents Tab Control | Shows tabs if the data container's No
Data Contents property is set to Yes. |
Show Repeater and Singleton Containers | Shows repeater and singleton containers
inserted in the report. |
Basic Report Structure
All reports have two components, a layout component
that defines the report appearance, and a query component that defines
report data. Understanding these components will help you design
effective reports.
Layout
A layout is a set of pages that defines the appearance
and formatting of a report. When you design the layout of a report,
you
present the data in a meaningful way by
using lists, crosstabs, charts, and maps
give the report the appearance you want by adding formatting,
such as borders, color, images, and page numbers
specify how the data flows from one page to the next
Pages
Pages are containers for the layout objects that you use to build
a report. A page is made up of the following mandatory and optional
components:
page header (optional)
page body (mandatory)
page footer (optional)
When you run a report, the amount of data queried often exceeds
one page. As a result, a page will repeat until all the data is
shown. You have control over how data flows from one page to the next.
For example, here are alternative representations of a report that
contains a chart and a lengthy list.
The chart appears on its own page. The list begins on the
next page and fills subsequent pages until all rows appear.
The chart and the first few rows of the list appear on the first
page. The rest of the data in the list appears on the subsequent
pages.
Objects
You add layout objects to a page when you create a report. Below
are objects that you will use often when building reports in Report
Studio:
list
Add a list to show data in
rows and columns.
crosstab
Add a crosstab to show data in a grid, with
dimensions along the rows and columns, and measures in the cells
or intersection points.
chart
map
repeater
Add a repeater to show each instance of a
certain column or data item in a separate frame.
text
block
Add a block to hold text or other information.
Blocks are often used to lay out horizontal bands of information.
table
For information about other layout objects you can add to a report,
see Insert Other Objects.
Queries
Queries determine what data items appear in the report.
Sometimes you want detail rows of data, which you obtain by using
a simple SELECT statement. Other times you must calculate totals
or averages using aggregate functions and grouped columns, or must
apply filters to show only the data you want.
Report Studio automatically creates the queries you need as you
build reports. However, you can modify these queries or create your
own custom queries to get the results you want.
For more information about queries, see Working with Queries.
Working with Objects
You build reports by adding objects and manipulating
them to obtain the results you want. To understand how to work with
objects in Report Studio, you must be familiar with the following concepts:
For information about Report Studio objects, see Report Studio Object and Property Reference.
Object
Types
In Report Studio, layout objects are either inline or block.
You can insert other objects on the same line as an inline object,
but not on the same line as a block object. When you insert an object
to the left or to the right of a block object, the object appears
on the line above or below the block object respectively. Examples
of inline objects include graphics and text items. Examples of block
objects include any report type (list, crosstab, chart, map, or
repeater) and tables.
Note: You can also use an object’s floating property
to define how other objects flow around the object. For example,
you can specify how text flows around an image.
Objects as Containers
Objects, such as tables , blocks , and any report frame ,
are containers in which you can insert other objects. For example,
you can insert a list in one cell of a table and a chart in another.
Tip: You can also nest objects to create a sophisticated
layout. For example, you can insert a table in a cell of another
table.
Locking and Unlocking Objects
To manipulate the contents of some objects, you must first unlock
the object. For example, you have a list that contains the column
Product Name. You want to insert a graphic inside the Product Name
column to show an image of each product. Unlocking the list allows
you to insert the image object inside a list column.
Tip: From the Structure menu, click Lock
Page Objects  .
Toggling this menu item locks and unlocks all layout objects in
a report. However, this setting is not saved with the report.
.
Toggling this menu item locks and unlocks all layout objects in
a report. However, this setting is not saved with the report.
Hierarchy of Objects
In Report Studio, objects are organized hierarchically. For example,
a list contains list columns, and each list column contains a text
item, which is the name of the inserted data item.
The hierarchy of objects is useful to remember when you apply
formatting because formatting is applied to the child objects of
the object. For example, you can specify that all list column titles
in a list have red as the background color. The formatting is automatically
applied to any new columns you add to the list, because the formatting
is applied to the list and is therefore applied to the objects in
the list. If you apply formatting to a specific object, it will
override the same formatting specified for the parent object.
Find Objects in a Report
You can quickly locate specific objects in a report
by using Find.
Steps
From the Edit menu, click Find.
Click Find what and choose the type
of object that you want to find.
In the Options box, specify the search
criteria that you want.
For example, if you want to find the objects that reference a
specific data item, you must specify the query that contains the
data item and the data item name.
Click Find Next.
The first object that meets the search criteria is selected
in the report. Continue clicking Find Next to
show all other objects that meet the search criteria.
Note: In some cases, such as searching for a data item
that is used to define a conditional style, Report Studio cannot
directly select the object in the report. Instead, Report Studio
selects the object that uses the object that you are searching for.
Set Options
Set the options you want when working in Report Studio.
View Options
|
Use Windows skin | Replaces the current appearance of the interface
with the display scheme specified by the Windows settings. |
Show startup dialog | Shows the Welcome dialog
box at startup. |
Reuse Cognos Viewer window | Reuses the same Cognos Viewer window when
you rerun a report without first closing the window. |
Resize Cognos Viewer window | Maximizes the Cognos Viewer window when
you run a report. |
Animate explorers | Animates the appearance of the Page
Explorer, Query Explorer, and Condition Explorer. |
Window startup size | Specifies the size of the Report Studio
window at startup. |
Edit Options
|
Wrap text in editors | Automatically wraps text in all editors
where you can define expressions. |
Automatically populate values
list | When building expressions in the expression
editor, automatically shows values when browsing the data of a data
item . |
Automatically validate expressions | Automatically validates expressions, such
as filters, created in the expression editor . |
In-place edit | Enables the editing of text in place when double-clicking. |
Allow drop replace in crosstab | When dropping an item from the Insertable Objects pane
over an existing item in a crosstab, replaces the original item. |
Double click insertion location | When working with dimensional data, specifies
where the child members are inserted when you double-click the member
data item. |
Layout dimensions | Specifies the width and height of the area
where you will create reports. |
Report Options
|
Alias member unique names | When working with a dimensional data source, creates
an alias when you add a member to the report or to an expression . |
Delete unreferenced query objects | Automatically deletes query objects linked
to another object. For example, if you delete a list, the query linked
to the list is deleted as well. |
Delete unreferenced conditional
styles | Automatically deletes conditional styles when the last data item that refers to the
conditional style is also deleted. |
Always create extended data items
for new reports | Determines whether Report Studio creates
extended data items or expression-based data items. Expression-based
data items allow you to view or edit the expression by double-clicking
the Expression property for the item. If
you are working with a dimensional data source and this option is
not selected, the appropriate dimensional data item is added when
you insert items such as members, levels, or calculated members.
For example, if you insert a level, a level set is created. This makes
it easier to work with dimensional data items because Report Studio
knows the data item type of the items that are in the report. |
Limit on inserted members | When working with a dimensional data source,
limits the number of child members that are inserted. For example,
you specify 3 for this option and in the toolbar you specify the
option to insert children when you drag a member to a data container .
You then drag the Camping Equipment member to the rows of a crosstab.
What you see as rows are the child members Cooking Gear, Tents,
and Sleeping Bags, and a row named Others(Camping Equipment) for
the remaining child members of Camping Equipment. |
Aggregation mode | When working with a dimensional data source, specifies
the aggregation type you want Report Studio to use when aggregating
values in crosstabs and charts. Within detail aggregates
the visible details. Within aggregate aggregates
the visible aggregates at the next lower level of detail. Within
set aggregates the member sets. For more information
about aggregating values in crosstabs and charts, see Aggregating Values in Crosstabs and Charts. |
Advanced Options
|
Use operating system clipboard | If Report Studio is running in Internet
Explorer, uses the Windows clipboard instead of the internal application
clipboard. Tip: If Report Studio is running in Firefox,
the internal application clipboard is always used. |
Allow local file access | Enables the opening and saving of reports
on your computer . |
Map feature display limit | When working with maps, specifies the maximum number
of features that can appear in a map. |
Member display count limit (in
source tree) | When working with dimensional data, specifies
the maximum number of members that can appear in the Insertable
Objects pane when performing a search . |
Steps
From the Tools menu, click Options.
On the View, Edit, Report,
and Advanced tabs, set the options you want.
Click OK.
Web Browser Settings
Cognos 8 uses the default browser configurations provided
by Microsoft, Netscape, and Firefox. For all browsers, you must
ensure that settings are enabled for cookies and Java scripts. Additional
required settings are specific to the browser.
|
Internet Explorer | Allow Cookies Active Scripting Allow
META REFRESH Run ActiveX controls and plug-ins Script
ActiveX controls marked safe for scripting Binary and Script
Behaviours Allow programmatic clipboard access |
Note: Report Studio uses the native
Microsoft Internet Explorer XML support, which is a component of
the browser. ActiveX support must be enabled because Microsoft implements XML
using ActiveX. Cognos 8 does not provide or download ActiveX controls.
Only the ActiveX controls that are installed as part of Internet
Explorer are enabled through this configuration.
For more information about browser configuration and cookies
used by Cognos 8, see the Installation
and Configuration Guide.
Authoring Modes
To meet the needs of both regular report authors and
financial report authors, Report Studio provides distinct custom
user interfaces that contain reporting features relevant to these
roles.
Access to each authoring mode is determined by the permissions
you have to secured functions and features. For more information,
see the Administration and Security Guide.
Professional Authoring Mode
The Professional authoring mode gives users access to the full
range of Report Studio functionality. In this mode, you can create
any report type, including charts, maps, lists, and repeaters, using
any data source (relational or multi-dimensional). It contains a
superset of the features available in the Express authoring mode.
However, you cannot view live data.
Express Authoring Mode
The Express authoring mode provides a simplified and focused
Report Studio interface. It is designed for non-technical users
to create traditional financial and management statement reports.
It only allows access to dimensionally-modeled data and uses a member-oriented
data tree.
This authoring mode allows you to see live data and supports
only crosstab reports. It contains a subset of the features available
in the Professional authoring mode.
When you are in the Express authoring mode, if you open a report
that was authored in the Professional authoring mode, you can see
but cannot modify objects that can be inserted only in the Professional
authoring mode, such as charts, maps, and lists.
Change Authoring Modes
If you have access to both the Professional and Express
authoring modes, you can switch between the two from within Report
Studio.
You may want to start authoring your report in the Express authoring
mode to see live data and easily create your report layout. Then,
you can switch to the Professional authoring mode to add more information,
such as charts and multiple pages.
Step