 .
.Create a calculated column to make a report more meaningful by deriving additional information from the data source. For example, you create an invoice report, and you want to see the total sale amount for each product ordered. Create a calculated column that multiplies the product price by the quantity ordered.
If an expression is used in multiple reports, or by different report authors, ask your modeler to create the expression as a standalone object in the model and include it in the relevant package.
If you want to perform a more complex calculation, using
expressions and functions, insert a calculated member .
You can add calculations to lists, crosstabs, and all other data containers. You can also add calculations directly to a page header, body, or footer. However, you must first associate a query to the page. For more information, see Add a Page.
Cognos does not currently support queries with both dimensional functions and running totals. Running totals are supported only for the overall level of a dimension.
In the Insertable Objects pane, click
the Toolbox tab  .
.
To create a calculation that will be applied to data, do the following:
Drag Query Calculation to the report.
The Create Calculation dialog box appears.
In the Name box, type a name for the calculation and click OK.
To create a calculation in the layout that contains run-time information, such as current date, current time, and user name, drag Layout Calculation to the report.
In the Available Components box, define the calculation:
To include data items not shown in the
report, on the Source tab  , double-click data items.
To include data items that are in the report but not necessarily
in the model, such as calculations, on the Data Items tab  , double-click data items.
To include data items from a specific query in
the report, on the queries tab, double-click data items.
To add functions, summaries, and operators to the filter expression, on the Functions tab, double-click elements.
To include a value that is derived from a parameter, on the Parameters tab  , double-click a parameter.
Parameters
are used to define prompts , drill-through reports ,
and master detail relationships .
Tip: You can also type the expression directly in the Expression Definition box.
For more information about creating expressions, see Using the Expression Editor.
To include data items not shown in the report, on the Source tab, double-click data items.
Click the validate expression button  and click OK.
When working with dimensional data, insert a calculated member or measure into your report to add a new row or column with values based on a calculation.
You use the expression editor to define the calculation.
You can also create a calculation that uses an intersection
(tuple) that you already defined .
In the Insertable Objects pane, click
the Toolbox tab .
Drag Calculated Member or Calculated Measure to the report.
In the Name box, type a name for the calculation.
In the Calculation hierarchy box, select the hierarchy within which this calculated member or measure is to be created and click OK.
The Data Item Expression dialog box appears
In the Available Components box, define the calculation:
If you want to include data items not
shown in the report, on the Source tab , double-click the data items.
If you want to include data items that are in the report
but not necessarily in the model, such as calculations, on the Data
Items tab ,
double-click the data items.
If you want to add functions, summaries, and operators to the filter expression, on the Functions tab, double-click them.
Click the validate expression button and click OK.
When working with dimensional data, an intersection, also known as a tuple, is useful for obtaining a value from the combination of two or more members that you specify. Each member must be from a different dimension.
You can insert an intersection to create a complex calculation
without using expressions. You can isolate the intersection of dimensional
selections to a single row or column, and then use the intersection
in other calculations .
An intersection appears as a single unified member instead of its component members. By combining members with measures or with time-related members, you can create an intersection that reveals important information about your business.
You can also use intersections to sort reports.
By default, when you add an intersection in your report, its label is a collection of its members, such as 2004, Web, and Cooking Gear. You can change the name of the label.
In the Insertable Objects pane, click
the Toolbox tab .
Drag the Intersection (Tuple) object to the report.
From Available members and measures, select the items you want to use and click the right arrow to move them to the Intersection members and measures list.
An intersection point in a crosstab or chart can contain a value that is derived from multiple calculations.
If the query expressions for the row and for the column that intersect in a crosstab both include calculations, the intersecting value is the result of performing both calculations. The second calculation is performed on the result of the first calculation. If you change the order in which the calculations are performed, the resulting value at the intersection point changes.
The solve order is a positive numeric value that you assign to data items. Negative values are not supported. The data item with the lowest value is calculated first, followed by the next higher value, and so on. The data item with the highest solve order is computed last. If you do not specify a solve order, the default value is 0. In crosstabs, if more than one data item has the same solve order, column items are calculated first and then row items.
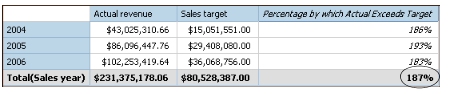
For example, a crosstab contains the columns Actual revenue, Sales target, and a third column that calculates the percentage by which actual revenue exceeds target revenue. The crosstab contains a row for each Sales year and a summary row that calculates the overall totals for each of the three columns. The cell where the percentage calculation and the overall total calculation intersect contains only one value. By default, Cognos 8 calculates the column percentage first, and the summary row is calculated last. The value that appears at the intersection is therefore a sum of the percentages, which is not a meaningful result. The value is more meaningful if the overall percentage is calculated after the actual and sales target revenues are summed. Specifying a solve order for the percentage calculation that is higher than the overall total calculation gives the following result:
It is not necessary to specify the solve order for the overall total calculation. Because the default solve order is 0, setting the solve order for the percentage calculation to a value higher than 0 is sufficient.
If a crosstab contains nested calculations, the calculations are performed in the following order by default:
outermost calculation on the columns
innermost calculation on the columns
outermost calculation on the rows
innermost calculation on the rows
If there are solve order ties, column items are calculated before row items, and outer nesting items before inner nesting items.
If an intersection point in a crosstab or chart contains
a value that is derived from multiple calculations ,
you can specify the order in which to perform the calculations.
The solve order must be a positive numeric value. The calculations
are performed from lowest to highest solve order value.
Setting the Rollup Aggregation Function property
to Calculated for a data item assigns
a solve order that is higher than any other data item in a query,
unless a solve order is explicitly specified. If there are multiple
data items that have the Rollup Aggregation Function property
set to Calculated, the normal rules for solve
order precedence apply.
Click the data item for which you want to specify the solve order.
A data item can have only one solve order value. Consequently, if a data item is in a query that is used in more than one data container, and you want the data item to have a different solve order in each container, you must use a separate data item.
Tip: In crosstabs, to specify the solve order for the
default measure , click the crosstab and, in the Properties pane,
click the select ancestor button  and
click Crosstab.
and
click Crosstab.
In the Properties pane, type an integer value in the Solve Order property.
To specify the solve order for the default measure, click Default Measure Solve Order.
Dimensional data sources may include data source calculations. Because Cognos 8 cannot predict the presence of such calculations, specifying the Solve Order property may be unable to resolve the solve order correctly. You can suppress potentially meaningless results when querying dimensional data sources that include data source calculations.
When a query-defined calculated member and a data source calculated member intersect, the value is the result of performing both calculations. The second calculation is performed on the result of the first calculation. Whether the final value is meaningful depends on the order in which the calculations are performed. Because Cognos 8 cannot determine the presence of data source calculated members ahead of time, it cannot determine the correct solve order automatically.
Note: Dimensionally modeled relational (DMR) data sources query one or more underlying relational databases, and therefore cannot contain data source calculations. They are not considered dimensional data sources in the context of this topic.
Pause the pointer over the query explorer button  and click the query that contains the data item
for which you want to suppress values.
and click the query that contains the data item
for which you want to suppress values.
In the Data Items pane, click the data item.
In the Properties pane, in the Calculation Intersection property, click Show "Not applicable".
When a query-defined calculated member and a data source calculated member intersect, the resulting value is suppressed. If the intersecting members do not contain data source calculations, the value is not suppressed.
