 .
.You can create a calculation if you need a comparison or ratio that does not exist in the data source, such as actual revenue as a percentage of planned revenue, or the average revenue per employee.
You can perform the following arithmetic calculations in an analysis.
| Arithmetic operation | Description |
| + (sum) | Adds the values of the selected items. |
| - (difference) | Subtracts the values of one selected item from another. |
| * (product) | Multiplies the values of the selected items. |
| / (division) | Divides the values of the selected items. |
| Absolute | Calculates the absolute value of the numbers in the selected item. |
| Round | Rounds the values in the selected item to the nearest integer. |
| Round down | Rounds the values in the selected item to the next lowest integer. |
| Square root | Calculates the square root of the values in the selected item. |
You can perform the following percentage calculations in an analysis.
| Percentage operation | Description |
| % | Calculates the value of a selected item as a percentage of another item. |
| % of total | Calculates each value of a selected item as a percentage of the total. |
| % difference (growth) | Calculates the difference between two items as a percentage. |
You can perform the following analytic calculations in an analysis.
| Analytic operations | Description |
| Average | Calculates the average of values of the selected items. |
| Maximum | Calculates the maximum value. |
| Minimum | Calculates the minimum value. |
| Median | Calculates the middle value in a set of numbers. |
| Roll up | Calculates the rolled up value. |
You can perform the following ranking calculations in an analysis. By default, the highest value is ranked 1.
| Ranking | Description |
| Rank | Calculates the rank of each value. |
| Percentile | Calculates a percentile, which is a value that corresponds to one of the equal divisions in a sample. For example, a score higher than 89 percent of those attained is in the 90th percentile. |
| Quartile | Calculates a quartile, which is a value that corresponds to the 25% point in a sample. The first quartile is the 25th percentile, the second quartile is the 50th percentile, and the third quartile is the 75th percentile. |
| Quantile | Calculates a quantile, which is a value that divides a sample into percentiles. For example, if the specified quantile is 5, the percentiles are 20, 40, 60, 80, and100. |
You can create a calculation if you need a comparison
or ratio that does not exist in the data source, such as actual
revenue as a percentage of planned revenue, or the average revenue
per employee. The calculations available depend on how many columns
or rows you select  .
.
Calculation results are not stored in the underlying data source. Instead, Analysis Studio reruns the calculation each time you view the analysis. The results are always based on the most current data in the data source.
An item-based calculation that you create has no inherent aggregation rule. Because "sum" is the most common aggregation rule, Analysis Studio provides the "sum" aggregation rule to calculations so that the appropriate solve order occurs.
If you have several calculations in a crosstab, you should
be aware of the default solve order  .
.
Note: Cells show "--" (two dashes) rather
than a value in calculations that use nonadditive measures such
as count or average. Nonadditive measures are distinguished by a
nonadditive measure icon ![]() in
the source tree.
in
the source tree.
Select the rows or columns that you want to use in the calculation.
Click the calculate  button
on the toolbar.
Choose whether to use a predefined calculation or create a member-based calculation:
To use a predefined calculation, click one of the predefined calculations.
To create an item-based calculation, click Custom.
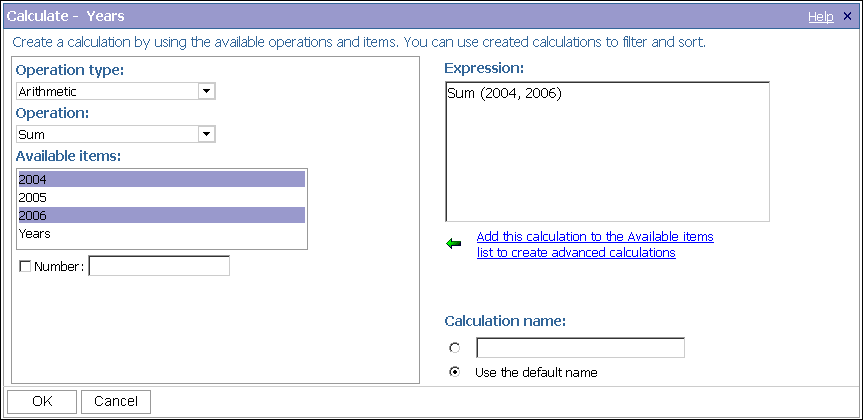
The Calculate dialog box appears.
In the Operation box, click the operation you want to perform.
Depending on the selected data, you may first need to choose an operation type from the Operation type box.
Choose which data to use for the calculation:
To use existing items, click the items you want in the Available items box.
To use other data, specify a number in the Number box.
Click OK.
The calculated results appear in a new row or column after the last item used as an operand in the calculation.
To make the name of the calculated row or column more meaningful, or to avoid a default heading name which is too long, type a new name in the Name box.
To edit a calculation, right-click the calculated row or column and click Edit this Calculation.

When calculations in the rows and columns of a report intersect, Analysis Studio performs the calculations in the following order:
addition or subtraction
multiplication or division
aggregation (rollup)
remaining arithmetic functions: absolute, round, round down, average, minimum, maximum, medium, count
percentage, % difference (growth) or % of total
rank, quartile, quantile, or percentile
If both calculations have the same precedence, for example, if they are both business functions, then the row calculation takes precedence.
If you have the necessary permissions, you can open your analysis in Report Studio and override the order of precedence by changing the solve order property. For more information, see the Report Studio User Guide.
Ranking items identifies their relative position to help you compare data.
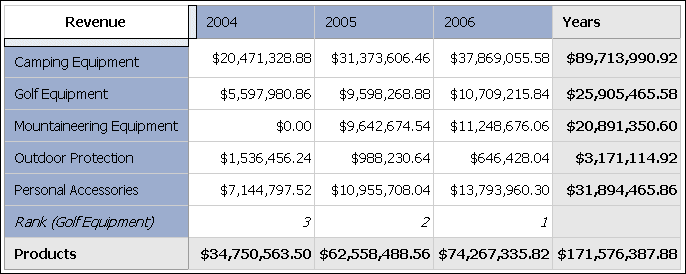
For example, you can rank a product line, such as golf equipment, to identify how well sales for golf equipment performed relative to other years.

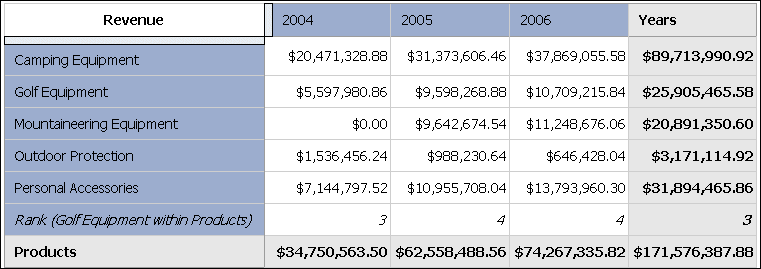
You can also rank to identify how well sales for golf equipment performed relative to other products in the same axis.

Ranking operations include rank, percentile, quartile, and quantile  .
.
If you use the default settings, you can rank values quickly by right-clicking a single row or column and clicking Rank.
Analysis Studio uses Olympic ranking for data sources.
The exception is that SAP/BW data sources use serial ranking.
Olympic ranking handles ties by assigning an equal rank to items with equal results. Serial ranking handles ties by assigning a sequential number to items in the order they are retrieved in the data source.
| Team Results | Olympic Rank | Serial Rank |
| Red 100 points | Red 1 | Red 1 |
| Green 50 points | Blue 2 | Blue 2 |
| Blue 75 points | Green 3 | Green 3 |
| Yellow 50 points | Yellow 3 | Yellow 4 |
| Orange 25 points | Orange 4 | Orange 5 |
Select a row or column to rank.
Click the calculate button  on
the toolbar.
Click Custom.
The Calculate dialog box appears.
In the Operation type box, click Ranking.
Choose the desired options under Operation, Available items, and Based on measure.
Under Rank, choose whether to rank within the selected item only, or to rank with other values on the same axis.
Click OK.
You can now sort the rank results to show them in numerical order.
By default, ranking is based on the innermost nested set and calculates the items that meet the filter criteria in the selected row or column. To calculate rank using different segments of the data or the outermost set, use custom ranking. For an example of custom ranking, see Example - Use Custom Rank.
Select a row or column to rank.
Click the calculate button  on
the toolbar.
Click Custom.
The Calculate dialog box appears.
In the Operation type box, click Ranking.
Under Rank, click Custom.
Choose the options that you want:
Specify whether to rank the highest value or the lowest value as number 1.
Change the scope of the rank, such as by ranking only within visible items.
Rank by the innermost or outermost nested set in a crosstab.
Click OK.
You can now sort the rank results to show them in numerical order.
