Report Studio provides a set of maps that you can use to represent tabular data in a spatial context. For example, on a map of the world, countries can be colored to represent the level of revenue. To edit the maps or create additional maps, use Map Manager. For more information, see Edit a Map.
Maps are most often used to show geographical areas, but they can be used to show other spatial information, such as a floor plan in a building, seats in an airplane, or parts of the human body.
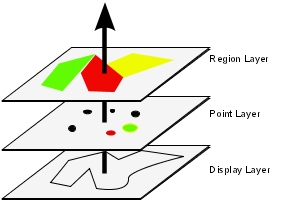
A map in Cognos 8 consists of a collection of layers. Each layer contains different information and acts like a transparency that is placed on top of the map. Each layer adds more information to the map. For example a map of the world may contain information related to countries on one layer and information related to cities on another level.
Report Studio maps provide the following three types of layers:
Region layer
Specifies the regions on a map to be differentiated according to values in the data source. For example, to show the revenue level for each country on a map of the world, choose Country as the region layer and then specify that the color of each country is based on the revenue value for that country. Regions can be set up for drilling through to other reports.
Point layer
Specifies the points to be placed on a map. The color and size of the points is based on the data that you select. For example, you choose to show cities as points on a map and set the color of each point by revenue and the size of each point by profit. Points can be set up for drilling through to other reports.
Display layer
You can show or hide items such as grid lines or capital cities. This layer is determined in the map file and not in the data source.
Note: If you intend to create CSV or XML output from your map, use only a point layer or a region layer. CSV and XML do not support the simultaneous use of both layers in the same map. Only one layer will be rendered in the output.
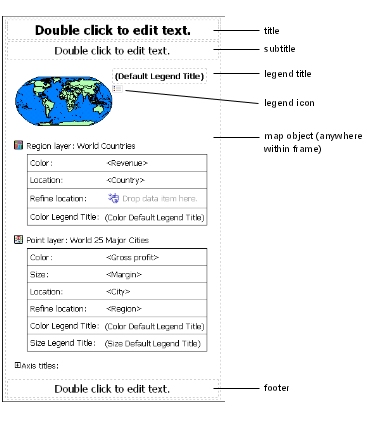
The following shows the parts of a map as they appear in the Report Studio interface.
You are a report author at The Great Outdoors Company. You are asked to show how revenue for the company is distributed throughout the world. This information can be shown in tabular format using a list report, but a map will create a more meaningful presentation. You decide to create a report that contains a map of the world showing the distribution of revenue by country.
In Cognos Connection, go to the GO Data Warehouse (query) package.
Click the Launch link in the upper right corner of the page, and then click Report Studio.
Report Studio starts.
In the Welcome dialog box, click Create a new report or template.
In the New dialog box, click Map and click OK.
In the Choose Map dialog box, in the Maps pane, expand the folder World and click World.
In the Region Layers box, click Countries + Territories.
In the Point Layers box, click None.
In the Display Layers box, click Oceans.
Tip: You can select multiple display layers or deselect a display layer by pressing Ctrl+right-click.
Click OK.
Tip: You can return to the Choose Map dialog box at any time by double-clicking the map background.
Click the run button on the toolbar, and view the map.
The map that you created in the previous topic is not yet linked to a data source. You will now specify the data values from your data source that will determine the color of each region.
In the Insertable Objects pane, expand Sales and Marketing (query), Sales (query) and Sales fact.
Drag Revenue to the Color drop zone.
Expand Employee by organization.
Drag Country to the Location drop zone.
Select the map object by clicking the map background.
Run the report.
You can specify that you do not require a match for each item in the data source. The report can then run successfully even if the map does not contain a match for each item in the data source for a particular object.
For example, an error message appears and the report does not run if you are using cities in the point layer and a city in the data source does not have the same name in the map file. If you ignore data with no features, then the data that has a match in the map file will be plotted and the data that does not have a match will be omitted.
Click the background of the map.
In the Data section of the Properties pane, click the Ignore Data with No Features property.
Set the value to Yes.
If the Ignore Data with No Features property is set to No, then each object that is called from the data source must have a matching label in the specified layer of the map file. For example, if your data source has a country named United States and the layer in the map file labels the same country USA, then there is a mismatch that must be corrected. Report Studio only makes you aware of a mismatch if each object in your data source does not have a corresponding label in the map file. If there are extra labels in the map file that do not have a match in the data source, the report will run without an error message.
A mismatch between your data and the map file must be corrected by the report author. It can not be corrected by a consumer of the map report at run time. There are two ways to correct a mismatch between your data and the labels in the map files. You can use Map Manager to edit the labels in the layers of the map file, or you can use the dictionary property to create an alias for each mismatched object. When you use the dictionary property, it resolves the mismatch only for a single report, and is not shared with other reports. If you intend to continue using a map with the same data source, it is best to edit the map in Map Manager so that the labels match the objects in your data source.
For information about using Map Manager, see the Map Manager Installation and User Guide.
Select the map object.
The Title Bar of the Properties pane now shows the word Map.
In the General section of the Properties pane, click Dictionary, then click the ellipsis (...) button.
Click the new button  .
.
In the Dictionary Entry dialog box, click Search.
In the Search string box, type a word or part of a word that you want to search the map file for.
For example, if you are searching for United States, type in part or all of the name.
In the Search map layer box, click the layer that you want to search, and click Search.
In the Matching features box, click the label that you want to match your data source to and click OK.
In the Alias box, type the name as it appears in the data source and click OK.
For example, if the country in your data source is named USA, type USA as the alias.
To find out the name for the objects in your data source, run a list report. For example, you can run a list report to show the names of all the countries in your data source. For more information see List Reports.
Click OK.
The Point layer in a map is used to visually represent data for point locations, such as cities or sales outlets. Both the color and size of points can be based on data from your data source.
Open the Choose Map dialog box:
When you create a new map report, this dialog box appears automatically.
If you are already in a map report, double-click the map background.
In the Point Layers box, select the layer containing the points that you want shown on the map.
For example, on a map of the world you may want the points to represent cities.
Click OK.
In the Insertable Objects pane, drag an object to the Color drop zone in the Point Layer.
For example, to have the color of the point based on revenue, drag Revenue from the Insertable Objects pane to the Color drop zone.
In the Insertable Objects pane, drag an object to the Size drop zone in the Point Layer.
In the Insertable Objects pane, drag an object to the Location drop zone in the Point Layer.
The object must be supported in the map file as a point location. For example, in the World sample map, city is supported as a point location, but country is not.
If you need to refine the location, drag an object to the Refine Location drop zone.
Use this drop zone when there is more than one location with the same name. For example, if you try to run a report with cities in the point layer, and there is more than one city in your data source with the same name, the report does not run. An error message indicates that there are cities in your data source with duplicate names. You can differentiate the cities by using the data object Region to refine the location.
You can add colors for regions or points and specify values to determine when those colors are shown.
In the report, click the Region Layer or Point Layer.
In the Color & Background section of the Properties pane, click Palette, and then click the ellipsis (...) button.
Click the new button ,
and click Color.
A new color is added to the list of colors.
With the new color selected, click Color in the right pane of the dialog box, and select a color.
Change the percentage boundaries for the colors.
Click OK.
The size of the points used on a map is defined in the Properties pane.
In the point layer, click the measure in the Size drop zone.
For example, if the measure is Revenue, click it.
In the General section of the Properties pane, click Minimum Size, and select or type the minimum point size for points on the map.
Click Maximum Size, and select or type the maximum point size for points on the map.
You can add map titles, subtitles, and footers. In addition, the axis title is shown below the map. By default, the axis title shows the name of the map specified in the map file.
Select the map object.
In the Chart Titles section of the Properties pane, click the Title, Subtitle, Footer, or Axis Title property and click Show.
Double-click in the box that appears on the report and type the text that you want.
By default, the axis title uses the name of the map.
There are legend titles for the entire legend, for the color of the regions, for the color of the points, and for the size of the points.
If the legend title is not showing, click the legend icon ![]() . In the General section
of the Properties pane, set the Legend
Title to Show.
. In the General section
of the Properties pane, set the Legend
Title to Show.
In the report, double-click the legend title and type the title you want.
By default the legend titles are taken from the object you’ve selected from the data source. To change a title, do one of the following:
In the Insertable Objects pane, drag a text or calculation object to the Color Legend Title drop zone in the Region Layer or Point Layer, or the Size Legend Title drop zone in the Point Layer.
Double-click the Color Legend Title or Size Legend Title drop zone, to change from the default legend title, then double-click the drop zone again. In the Text dialog box, type text for the legend title.
You can add one or more notes, determine their position in the map report, and specify borders around notes.
Select the map object.
In the Chart Annotations section of the Properties pane, click Notes, and then click the ellipsis (...) button.
Click the new button ,
and click OK.
A note icon with the words New Note appears in the report.
Click New Note next to the note icon  .
.
In the Text Source section of the Properties pane, click the Text property, and then click the ellipsis (...) button.
Type the text that you want to appear in the note and click OK.
In the report, click the note icon .
In the Positioning section of the Properties pane, type values to specify the bottom position, left position, height, and width for the note.
The location of the note is defined by the number of pixels.
Use the Note Border property to specify a border around the note.
Run the report to view the note.
If necessary, change the position again.
When you select an element in a map, you can view its properties in the Properties pane. Some properties are dependent on the existence of other properties.
If you are familiar with using conditional variables, you can customize the map to change appearance or provide information in response to expressions or conditions.
When you change a map property, you usually do not see the change until you run the report. Changes to the properties of labels and titles are reflected immediately.
These are some of the properties you can change in maps. These properties are available when you select the map object, unless specified otherwise in the Action to perform in the Properties pane column.
Goal | Action to perform in the Properties pane |
Hide or show the title, subtitle, footer, or axis title | Under Chart Titles, change the Title, Subtitle, Footer, or Axis Title property. |
Hide or show the legend | Under Chart Annotations, change the Legend property. |
Hide or show map labels | Select the region or point layer. Under Chart Labels, change the Labels property. |
Hide or show values on the map | Select the region or points layer. Under Chart Labels, change the Values property. |
Hide or show the border around the legend | Select the legend icon. Under Box, change the Borders property. |
Change the border around the map object | Under Box, change the Border property. |
Hide or show the tooltips Note: Some versions of Acrobat Reader do not support tooltips. | Under Chart Labels, change the Tooltips property. |
Change the amount of white space around the map | Under Box, change the Padding or Margin property. |
Change the default colors for all map elements | Under Color & Background, change the Background Color, Foreground Color, or Fill Effects property. |
Change the font and the alignment of text | Under Font & Text, change the Font or Relative Alignment property. |
Resize the map | Under Positioning, change the Size & Overflow property. |
Change the font for the legend | Select the legend icon. Under Font & Text, change the Font property. |
Change the format of values in the legend | Select the value in the region or point layer. Under Data, change the Data Format property. |
Select the map object or map element that you want to change:
To change general properties, such as size and color, click the map object.
To change specific map elements, such as a layer or title, click the element itself.
Tip: To cancel a selection, press the Esc key.
In the Properties pane, click the property you want, and then make the desired changes.
An ellipsis (...) button indicates that a dialog box provides further options.
You may have to scroll to see all the properties.
You can link regions or points on a map to another report. For example, on a map of the world, you can specify that when you click on China, a map of China opens.
Open the target report.
From the Data menu, click Filters.
On the Detail Filters tab, click the
add button .
In the Available Components box, click the source or Data Items tab to select the data item you want to use.
For example, if you want the target report to open when Canada is clicked in the source report, expand Countries and double-click Country.
In the Expression Definition box, type an operator after the data item or select an operator from the Functions tab and then enter a value.
For example, if you want the report to open when Canada is clicked in the source report, the expression would be as follows:
[Country]='Canada', where [Country] is the name of the data item in the package.
Save the target report.
Open the source report.
Select the region layer or the point layer.
In the Data section of the Properties pane, click Map Drills, and then click the ellipsis (...) button.
In the Map Drills dialog box, click the new button.
In the Search String box, type the name of the feature you want to use for the drill-through link, select it from Matching Features box, then click OK.
For example, if you want a report to open when you click on Canada, search on all or part of the word Canada then select Canada.
In the Drill-Through Definitions dialog
box, click the new button .
Click the ellipsis (...) button beside the Report box, and select the target report.
Click OK.
Run the report.
When you click the selected feature in the source report, the target report will open.
Administrators and modelers use a Windows utility named Map Manager to import maps and update labels for maps in Report Studio. For map features such as country and city names, administrators and modelers can define alternative names to provide multilingual versions of text that appears on the map.
With Map Manager you can edit the labels in maps to be consistent with the object names in your data base.
For instructions, see the Map Manager Installation and User Guide.
Additional maps are available from the Cognos Global Customer Services Web site. Much of the mapping data on the Web site is derived from MapInfo Corporation, the Cognos preferred provider for location intelligence. MapInfo provides a wide variety of global data including
detailed accurate roads
political, postal, and census boundaries
industry-specific data, such as communication system boundaries, insurance risk related data, and business prospect data
The Cognos Global Customer Services Web site provides a list of data providers and descriptions of the map data that Cognos provides as part of Cognos 8.
Sophisticated mapping functionality, known as location intelligence, can be used for a broad range of business applications that extend the mapping capability of Cognos 8. MapInfo provides solutions that can be directly integrated with Cognos 8. These include the ability to dynamically create geographic filters and custom areas for aggregating data for ad-hoc analysis. Examples of business applications of location intelligence are listed in the following table.
| Business application | Benefits |
| Target marketing | Learn who your best clients are and find more like them. |
| Network optimization and site location analysis | Put stores near your customers and look for gaps in geographical coverage. |
| Routing and work force optimization | Reduce the number of trucks you need and make your drivers more efficient. |
| e-government | Provide citizens with self-service opportunities. |
| Sales territory creation | Create balanced sales territories. |
| Economic development | Plan the development of your community. |
| Communications network planning | Avoid costly mistakes by putting cell towers in the right locations. Identify the locations of clients in your service area. |
You can contact MapInfo for both data and location intelligence solutions through their Web site: www.mapinfo.com.
