Use crosstab reports to show information in a more compact form than in a grouped list. For example, create a crosstab report to show total sales by product line generated by each sales representative.
Like list reports, crosstab reports are reports that show data in rows and columns. However, the values at the intersection points of rows and columns show summarized information rather than detailed information.
For information about how to create a crosstab report, see the Report Studio Tour.
When you add data items to crosstabs, you create crosstab nodes and crosstab node members. These objects allow you to easily create crosstabs, using drag-and-drop operations.
Crosstabs are dimensional objects that have row edges and column edges. Each edge is composed of a set of crosstab nodes. Each crosstab node contains the following:
One or more crosstab node members.
Zero or one nested crosstab node, which contains one or more crosstab node members or nested crosstab nodes.
Each crosstab node member refers to a data item that contains an expression that defines the members that appear in the crosstab.
The following crosstab contains four crosstab nodes.
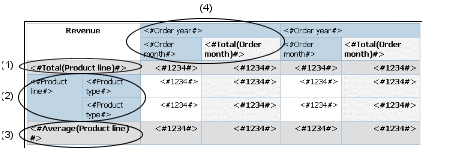
Crosstab node 1 contains a single node member for the total. This node refers to the data item Total(Product line).
Crosstab node 2 contains a crosstab node member that refers to the data item Product line. This member has a nested crosstab node containing a crosstab node member that refers to the data item Product type.
Crosstab node 3 contains a single node member for the average. This node refers to the data item Average(Product line).
Crosstab node 4 contains a crosstab node member that refers to the data item Order year. This member has two nested crosstab nodes. The first node contains a crosstab node member that refers to the data item Order month. The second node contains a crosstab node member for the total. This node refers to the data item Total(Order month).
Tip: Nodes are also created when you add data items to charts.
Crosstab nodes can be placed anywhere in the crosstab. For example, in the previous diagram, you can drag Order month under Average(Product line) to create a row edge.
To move nested items from one edge to another, ensure that you
select the crosstab node and not the crosstab node member. For example,
in the previous diagram, you want to move Product line and Product
type to the column edge. To do this, click Product
line, and in the Properties pane,
click the select ancestor button  ,
and click Crosstab Node. Both Product
line and Product type are selected.
,
and click Crosstab Node. Both Product
line and Product type are selected.
In the Structure menu, the Create Crosstab Nodes option affects the drag-and-drop behavior in crosstabs. When the option is turned on, and you add a data item to a crosstab, the item is created as a crosstab node. If the option is turned off, the item is created as a crosstab node member to an existing crosstab node.
For example, in the previous diagram, if the option is turned on and you drag Country from the Insertable Objects pane beneath Product line, Country becomes a new peer node to Product line. If the option is turned off, Country becomes a new peer node to Product line and has Product type as a nested crosstab node. This happens because instead of adding a new node, you are adding a new member to the existing node that already contains Product line.
Tip: To create discontinuous crosstabs  ,
turn the crosstab node creation option on. If you want the items
on the edges of crosstabs to be related (contain the same nested
items), turn the crosstab node creation option off.
,
turn the crosstab node creation option on. If you want the items
on the edges of crosstabs to be related (contain the same nested
items), turn the crosstab node creation option off.
Create a single-edge crosstab report to show data in a list-like form. For example, you want a report that shows the quantity of products sold for each year and for each order method. Create a crosstab with Order Year and Order Method as rows and Quantity as the measure.
From the File menu, click New.
Click Crosstab and click OK.
In the Insertable Objects pane, on
the Source tab  ,
click the data item you want to add to the crosstab and drag it
to Rows or Columns.
,
click the data item you want to add to the crosstab and drag it
to Rows or Columns.
A black bar indicates where you can drop the data item.
Repeat step 3 to insert additional data items.
If you dragged the data item in step 3 to Rows, drag the additional items above or below the first item.
If you dragged the data item in step 3 to Columns, drag the additional items to the left or right of the first item.
To add measures to the crosstab, drag the measures you want to Measures.
When you run the report, a crosstab is produced that has only one edge.
Nest data in a crosstab report to compare information by using more than one data item in a column or row. For example, a report shows the number of sales by product line for the past fiscal year. You decide to add a data item to further break down the number of sales by quarter.
When nesting columns in a crosstab report, there are four distinct drop zones where you can insert a new data item. The drop zone you choose will define the relationship between the data item and the column.
The following relationships are created when you insert a data item as a row:
Inserting a data item to the left or right of a column creates a parent-child relationship between them.
When you insert a data item to the left of a column, the data item becomes a parent to the column. When you insert a data item to the right of a column, the data item becomes a child of the column.
Inserting a data item above or below a column creates a union relationship between them.
The following relationships are created when you insert a data item as a column:
Inserting a data item to the left or to the right of a column creates a union relationship between the data item and the column.
Inserting a data item above or below a column creates a parent-child relationship between them.
When you insert a data item above a column, the data item becomes a parent to the column. When you insert a data item below a column, the data item becomes a child of the column.
For example, you have a crosstab with Product line as rows and Quantity and Revenue as nested rows. For columns, you have Order method with Country as a nested column.
Product line is a parent to Quantity and Revenue.
Quantity and Revenue are peers.
Order method is a parent to Country.
In the Insertable Objects pane, on
the Source tab ,
click the data item you want to add to the report.
Drag the data item to the location in which you want it to appear as a nested column or nested row.
A black bar indicates where you can drop the data item.
Repeat steps 2 to 3 to add other nested columns or rows.
Tip: If you add more than one measure to a crosstab,
all measures appear as columns. You cannot have one measure appear
as a row and another as a column. To make all measures appear as
rows, swap columns and rows .
Format crosstabs to give them the appearance you want. You can specify formatting for rows, columns, and fact cells in a crosstab, or for the entire crosstab. When you specify formatting for all rows, columns, fact cells, or the crosstab, the formatting is automatically applied to any new items you add.
If you apply the same styles, such as font color, to crosstab rows, columns, and crosstab intersections, the styles are applied in the following order:
crosstab fact cells
fact cells in the outermost rows
fact cells in the innermost rows
fact cells in the outermost columns
fact cells in the innermost columns
crosstab intersections
The style applied to the last object in the list overrides styles applied to previous objects. In addition, class styles are applied before styles that you apply manually.
You can also quickly format crosstabs by applying table
styles , and add white space to a crosstab by inserting
crosstab space objects .
To format the entire crosstab, do the following:
Click anywhere in the crosstab.
Click the select ancestor button in
the title bar of the Properties pane and click Crosstab.
In the Properties pane, click the property you want and then specify a value.
For example, to specify a background color, click Background Color and choose the color you want to use.
To format all rows, columns, or fact cells, click a row, column, or fact cell in the crosstab and then do the following:
If you clicked a row, click the select ancestor button in the title bar of the Properties pane and click Crosstab Rows.
If you clicked a column, click the select ancestor button in the title bar of the Properties pane and click Crosstab Columns.
If you clicked a fact cell, click the select ancestor button in the title bar of the Properties pane and click Crosstab Fact Cells.
In the Properties pane, click the property you want and then specify a value.
For example, to specify a background color, click Background Color and choose the color you want to use.
Tip: You can also right-click the row or column and click Select Fact Cells.
To format all crosstab cells for a specific row or column, do the following:
Click the row or column.
Click the select ancestor button in the title bar of the Properties pane and click Crosstab Member Fact Cells.
Tip: You can also right-click the row or column and click Select Member Fact Cells.
In the Properties pane, click the property you want and then specify a value.
For example, to specify a background color, click Background Color and choose the color you want to use.
To format all row or column titles, do the following:
Click a row or column title.
Click the select ancestor button in the title bar of the Properties pane and click Crosstab Rows or Crosstab Columns.
In the Properties pane, click the property you want and then specify a value.
For example, to specify a background color, click Background Color and choose the color you want to use.
To format an individual row, column, or intersection, do the following:
Click the row, column, or intersection.
Tip: To
format the data in a row, column, or intersection, click the unlock
button  in the toolbar and then click the text
item you want to format.
in the toolbar and then click the text
item you want to format.
In the Properties pane, click the property you want and then specify a value.
For example, to specify a background color, click Background Color and choose the color you want to use.
Tip: In cases where fact cell formatting applied to rows conflicts with fact cell formatting applied to columns, you can use the Fact Cells Precedence property in the Properties pane to determine whether the row formatting or the column formatting has precedence. To specify this property, click anywhere in the crosstab. Then click the select ancestor button in the title bar of the Properties pane and click Crosstab.
For more information about formatting reports, see Formatting a Report.
You can indent crosstab node members to set them apart from surrounding data.
When you insert a hierarchy in the rows, all members are automatically indented according to their level. By default, the first member in a set is not indented. If you insert a hierarchy in the columns, the members are not automatically indented. You can change the indentation properties of members in the report.
You can also
indent objects by applying padding .
Click the crosstab node member that you want to indent.
In the Properties pane, select Level Indentation, and then click the ellipsis (...) button.
In the Level Indentation dialog box, specify your indentation type, length, and direction, and then click OK.
Relative indentation means that the member will shift by one tab when the member's level increases relative to the previous member in the hierarchy.
Indenting based on the level in the hierarchy means that the member will shift the number of tabs equivalent to the level in the hierarchy.
Change a list report into a crosstab report to view your data from a different perspective.
Click the columns that you want to appear as columns or nested columns in the crosstab.
From the Structure menu, click Pivot List to Crosstab.
The list becomes a crosstab, with the columns you selected in step 2 appearing as columns and nested columns. The unselected columns, except for measures, appear as rows and nested rows. If you have one measure, it becomes the cells of the crosstab. If you have more than one measure, they appear as columns.
Tip: To make all measures appear as rows, swap columns
and rows .
You are a report author at The Great Outdoors Company, which sells sporting equipment. You are requested to create a report showing sales by order method to determine which methods are generating the most revenue and the highest sales volume.
In the Cognos Connection Welcome page, click the Public Folders link.
Click the GO Data Warehouse (query) link, click the Launch link in the upper right corner of the page, and then click Report Studio.
In the Welcome dialog box, click Create a new report or template.
In the New dialog box, click Crosstab and click OK.
In the Insertable Objects pane, on
the Source tab ,
add the following data items to the crosstab:
Expand Sales and Marketing (query) and Sales (query).
Expand Product and double-click Product Line to add it as rows.
Expand Order Method and double-click Order Method to add it as columns.
Click Product type and drag it just to the right of Product line.
Product type is now nested in Product line.
Expand Sales fact. Drag Quantity to the Measures area to add it as a measure.
Drag Revenue to the right of Quantity to add it as a second measure.
Click any part of the crosstab and then click the select
ancestor button in the title bar of the Properties pane.
Click Crosstab.
In the Properties pane, double-click the Font property.
In the Size box, click 8pt and click OK.
Click one of the measures.
Click the aggregate button and click Maximum.
When you run the report, you can see that for camping equipment, Cooking Gear generated the highest sales volume for the Special order method, and Tents generated the most revenue. Tents ordered by the Web order method generated the largest revenue.
You are a report author at The Great Outdoors Company, which sells sporting equipment. You are requested to create a report showing sales for each product line by quarter and by order method. Since the report will have columns with data from different dimensions, you create a discontinuous crosstab report. Discontinuous crosstabs are also known as disconnected or disjoint crosstabs, or crosstabs with unrelated columns.
In the Cognos Connection Welcome page, click the Public Folders link.
Click the GO Data Warehouse (query) link, click the Launch link in the upper right corner of the page, and then click Report Studio.
In the Welcome dialog box, click Create a new report or template.
In the New dialog box, click Crosstab and click OK.
In the Insertable Objects pane, on
the Source tab ,
drag the following data items to the crosstab:
Product line from Product to Rows
Order method from Order Method to Columns
Revenue from Sales fact to Measures
Pause the pointer over the query explorer button  and click Query1.
On the Toolbox tab, drag Data Item to the Data Items pane.
The Data Item Expression dialog box appears.
In the Expression Definition box, type the following and click OK:
[Employee summary (query)].[Employee by region].[Region]
In the Properties pane, double-click the Name property, rename the data item Region, and press the Enter key.
Pause the pointer over the page explorer button  and click Page1.
On the Source Tab, drag Region to the left of Order method.
Tip: Ensure that the pointer is directly beside Order method before you drop Region. Otherwise, Region may appear as a nested row instead of a column.
Click Region.
In the Properties pane, double-click the Sorting property.
From the Data Items pane, drag Region to the Sort List pane.
Click the sort order button to sort quarters in ascending order.
Run the report.