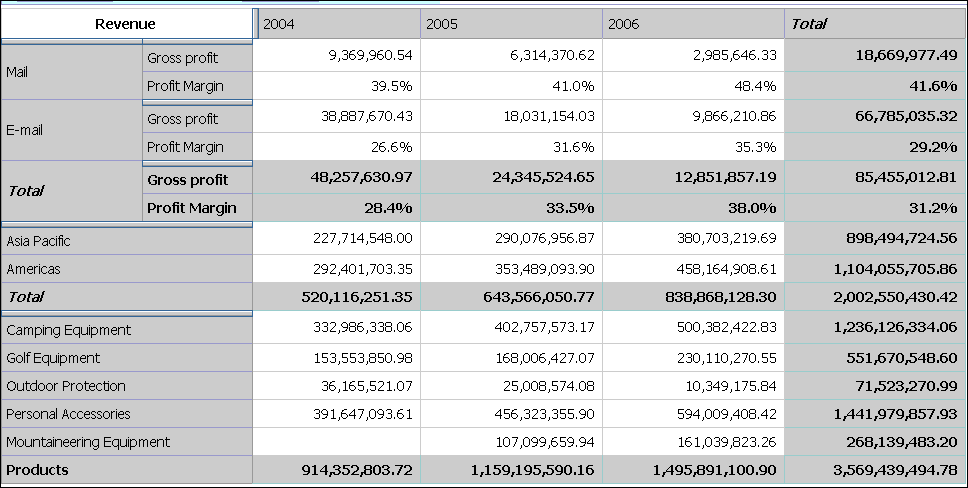
You can create asymmetrical crosstab layouts.
In this topic, you learn how to view several kinds of data in a single crosstab. You want answers to these questions:
How much are the gross profit and profit margin for two specific order methods?
How much is the revenue for all products?
How much revenue was generated by two specific markets?
If you need more help, see Insert Items and Insert Sets of Items in Complex Layouts.
Create a new analysis using the Sales and Marketing (cube) package.
Add the following items to the crosstab:
Revenue as the default measure
2004, 2005, and 2006 (in Time) in the columns
E-mail and Web (in Order Method) in the rows
Gross profit and Profit Margin (in Measures) as nested rows
Add Products as a stacked set under Order Method.
You now want to insert a new set between Order Method and Products.
Select Products as the target location in the crosstab.
In the source tree, press Ctrl+click to select Asia Pacific and Americas (in Retailers).
Right-click the selected names and, from the Insert menu, click Above Selected Set.
Your analysis will look like this.

