 .
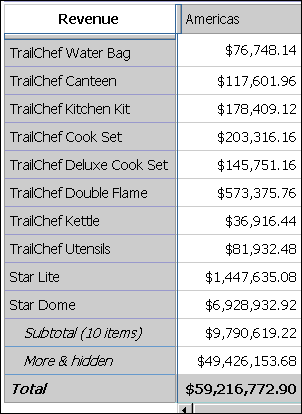
. Subtotals present data more conveniently when large
dimensions contain too much data to be shown in the crosstab. A
subtotal summarizes the measure based on the rules defined in the data
source or model. You can specify the number of items to show in
the crosstab  .
.

The following table describes each subtotal.
| Subtotal | Description |
| Subtotal (visible) | The sum of the visible items, which is updated automatically as you change the data in the crosstab. |
| More More & Hidden | The values of the remaining items beyond the specified number that still meet any filter criteria. More changes to More & Hidden if there are any hidden values. This subtotal is updated automatically as you change the data in the crosstab. |
| Total (included in the filter) | The sum of the subtotal of visible items and the More or More & Hidden subtotal. |
| Subtotal (Excluded) | The sum of values that are excluded, such as by being filtered out. |
| Summary | A grand total of all the previous subtotals. |
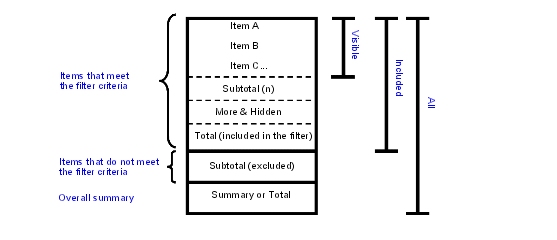
The following diagram shows how subtotals are broken down.

You can use screen space most efficiently by specifying which subtotals to show and which subtotals to hide.
You can specify the default subtotals to show for all existing and new sets in the analysis. You can also override these default settings for individual sets.
You can also show and hide subtotals using the properties
pane  .
.
The only subtotal you can use with selection-based sets is Total.
Choose whether to specify the default subtotals to show for all existing and new sets in the analysis or for an individual set:
To specify the default subtotals to show for all existing and new sets, from the Settings menu, click Totals and Subtotals.
Tip: To view the values for the More & hidden subtotal, change Don’t show values to Show the values.
To specify the default subtotals to show for an individual set,
select the set, and then click the subtotals button  on the toolbar.
Select the subtotals that you want to show and clear the subtotals that you want to hide.
Click OK.
