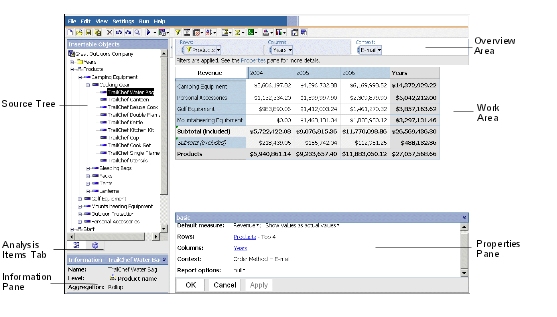
The Analysis Studio window consists of three panes (the Insertable Objects pane, the Information pane, and the properties pane), a work area, and an overview area.
The work area contains the crosstabs and charts that you use to explore and analyze data. You can view your analysis as
a crosstab
a chart
a crosstab and a chart
Analysis is a process in which you explore the relationships between items to help you understand your business. The crosstab helps you discover whether the value of one item is associated with that of another. You can quickly change, limit, or expand the items you see in the crosstab, using techniques such as filtering and drilling, to quickly focus on the most significant items.
Tip: You can use the display button  on the toolbar to show only the chart,
only the crosstab, or both.
on the toolbar to show only the chart,
only the crosstab, or both.
An item is an element that you can manipulate in the work area. Items include rows, columns, sets, and so on. A member is a common term for an item in the dimensional hierarchy of the source tree. Members added from the source tree to your analysis are also items.
The Source tab of the Insertable Objects pane contains the source tree for the package selected for the analysis.
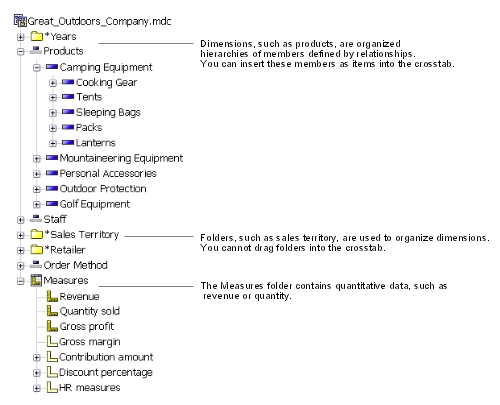
The source tree presents a dimensional view of your data, organized into dimensions, hierarchies, levels, and measures.
Note: The names of levels and members in a dimension come from the model. It is the responsibility of the modeler to provide meaningful names.
The Measures folder contains quantitative data, such as revenue or quantity.
By default, the maximum number of items shown in the source tree is 50. Your administrator may set a different value for optimum performance, depending on the size of the data source.
The following is an example of a source tree.
When you open an analysis that contains the years 2005 and 2006 in the rows from the Years hierarchy, the crosstab simply compares the years 2005 and 2006.
In the source tree, the time dimension may also contain relative time hierarchies, such as Current Month, Last Month, QTD, Prior QTD, YTD, Prior YTD, and so on. Current Month contains the most recent month of data in the cube, and the other hierarchies are relative to Current Month.
For example, you insert Prior YTD into the rows, then nest YTD into the rows under Prior YTD. If the current month is December 2006, the analysis shows the results for January to December 2005 versus January to December 2006.
If you save the analysis and open it the following year, when the current month is June 2007, the analysis shows results for January to June 2006 versus January to June 2007. The results shown in your analysis change, relative to Current Month in the updated cube.
The administrator may alter the date ranges for these items, or create specific relative time items based on the needs of your organization.
The Analysis Items tab contains
items created in the analysis, such as custom sets  and named sets.
The Information pane shows the name, level, attributes (if any), and aggregation associated with the selected item in the source tree, as well as any additional information provided by the data modeler.
Possible aggregation types for measures are sum, count, count distinct, count nonzero, and none.
Possible aggregation types for other items are rollup and computed.
Tip: To open or close the Information pane,
click the upward pointing  or
the downward pointing chevron
or
the downward pointing chevron  on
the right side of the pane.
on
the right side of the pane.
You can also use the Information pane to insert a level into the crosstab.
Cubes are updated frequently to ensure that they contain the latest information. You can see when a Cognos PowerCube was last updated by selecting the cube name in the Insertable Objects pane and then scrolling down to Cube updated in the Information pane. You can also add the last cube update information to the output of your analysis. For more information, see Set the Report Options.
The properties pane provides a comprehensive view of the crosstab or selected set in the work area.
You can also use the properties pane to make several changes and apply them at the same time, instead of running different commands. For example, you can
specify the number of items to show
create a user-defined filter
sort data
unhide data
If you select a set, the properties pane shows you the displayed
properties, such as subtitles and the number of visible items, and
undisplayed properties, such as filters and calculations, for that set.
If you click elsewhere in the crosstab, the properties pane shows
you the properties for that crosstab, such as the default measure ,
links to rows and columns, any existing context, and selected report
options.
Tip: To open or close the properties pane, do the following:
Click the upward pointing chevron or the downward pointing chevron on the right side of the pane.
This shows how the open properties pane appears when you select a set and open the properties pane.
You can use the overview area as a convenient place to quickly explore and change the contents of the work area.
The overview area shows any applied filters and sorting.
You can rearrange rows and columns, drill up or down , and provide context for
the work area .
A set selected in either the crosstab or in the overview area is also selected in the other.
Each box in the Rows area and Columns area
represents one or more sets in the crosstab. Stacked sets appear
as a single box labeled Combination. A selection-based
set appears as
a box with (list) appended to the label. For
information about stacked sets, see Crosstab Layouts. For information
about selection-based sets, see Sets.
If the crosstab contains nested rows or nested columns, you can drag the boxes that represent the items in the overview area to quickly change the nesting order.
Each box in the Rows area and Columns area also reflects the details shown in the work area. For example, when you change the number of visible items in the crosstab, the same number are shown in the Rows or Columns list.
You can also use the lists to drill up or down.
The context you specify applies as a whole to the work area. For example, you can drag Sales Territory from the Insertable Objects pane to the context area. When you click a specific territory from the list, the values in the crosstab change to represent data for that territory.
For information about using context as a filter, see Filter Values Using Context.
