Sparse data may result in crosstabs showing empty cells. For example, a crosstab that matches employees with products results in many rows of empty values for the revenue measure if the employee does not sell those products. To remove sparse data in an analysis, you can suppress empty cells that contain a null or zero value.
The suppression functionality available to you is determined by a setting configured by the administrator, and may be either totals-based or selection-based. For more information, see the Cognos 8 Administration and Security Guide.
You can tell which kind of suppression Analysis Studio is using, selection-based or totals-based, by the contents of the Settings menu.
Using selection-based suppression, you can select a single row or column to remove rows or columns in the opposite axis of the crosstab that contain only empty cells.
Important: Because selection-based suppression is context specific, the context for which you apply suppression is very important. In most cases, applying suppression to the Total row or column provides the results you need. In some cases, such as when multiple measures are used in the crosstab, this is not possible. With multiple measures, you can select an individual measure or multiple measures to define the context for your suppression. If you select only one of several measures on the crosstab, you may remove rows or columns for which data exists for other measures. For an example, see Use Selection-Based Suppression in a Multimeasure Crosstab.
Note: If the administrator has configured Analysis Studio to use selection-based suppression, all analyses previously created using totals-based suppression are automatically converted to the new suppression when opened.
Right-click a row or column and click Suppress Row or Suppress Column.
By default, Analysis Studio removes the opposite rows and columns that contain zeros and nulls. If you want to remove only nulls, from the Settings menu, click Suppress, and click Empty Cells Only.
Tip: To remove suppression, click Remove All Suppression.
You are a business analyst at the Great Outdoors Company, which sells sporting equipment. You are asked to compare the quantity of mountaineering equipment sold at each retailer site with the quantity of returns.
You want to remove the cells in the crosstab that do not contain any values.
Before you can try this example, you must set up the sample packages that come with Cognos 8. For more information, see the Cognos 8 Administration and Security Guide.
In the Cognos Connection home page, click the Public Folders tab.
Click the GO Sales (analysis) package.
Click the Analysis Studio link.
Analysis Studio opens, and data from the GO Sales (analysis) package appears in the source tree.
Expand the Sales (analysis) folder and drag Quantity to the Columns area in the crosstab.
Expand the Returned items (analysis) folder and nest Return Quantity next to the Quantity column.
Expand the Sales (analysis) folder down to the retailer site city level.
Right-click on any city and click Insert Level (Retailer Site) as rows.
Expand the Sales (analysis) folder down to the product line level and drag Mountaineering Equipment into the Context filter section of the overview area.
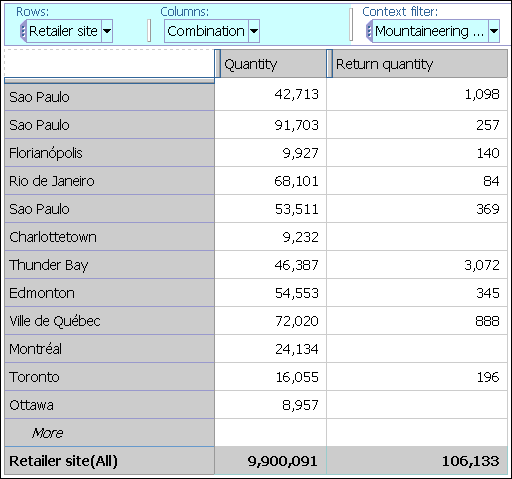
In the resulting crosstab, some retailer sites have sold products and have no returns.

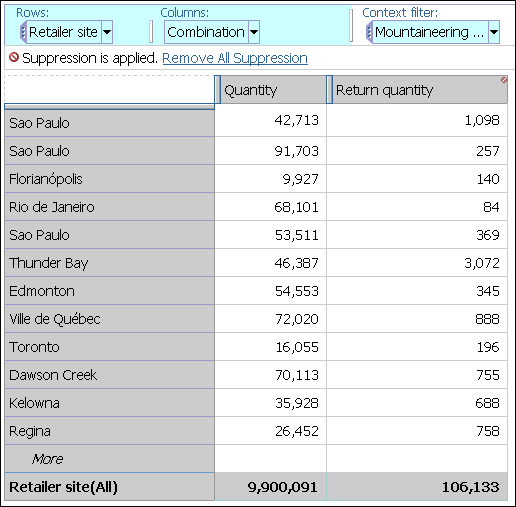
If you apply suppression on Return quantity, you remove the rows Charlottetown and Montreal because they have no returns of mountaineering equipment, even though they contain values for Quantity.

This is a good result if your main interest is in Return quantity. However, if you want to ensure that suppression is applied to the entire crosstab so that you remove only rows where all cell values are null or zero, you must apply suppression to each column so that the suppression picks up the context of each measure. By applying suppression to Quantity as well as to Return quantity, now Charlottetown and Montreal reappear in the crosstab.

Totals-based suppression removes rows or columns where the total results in a null or zero value throughout the analysis. You cannot remove sparse data from individual rows or columns.
In your analysis, if the columns contain a measure and the rows contain items, you cannot suppress rows. Similarly, if the rows contain a measure and the columns contain items, you cannot suppress columns. Instead, define a filter such as measure > O or measure IS NOT NULL to suppress rows or columns that have zero or null total values.
Note: If the administrator has configured Analysis Studio to use selection-based suppression, all analyses previously created using totals-based suppression are automatically converted to the new suppression when opened.
Click the suppress items button  on
the toolbar.
Choose where to apply the suppression:
Choose a suppression option to apply:
A suppression icon next to the item label in the overview area indicates that suppression is applied.
Tip: To remove suppression, repeat step 1 and click No Suppression.
