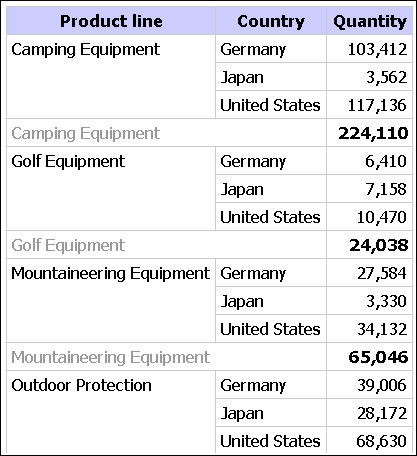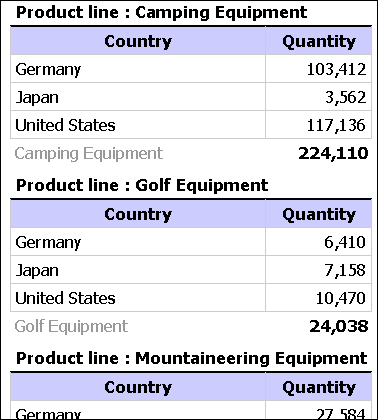
If a column in a report contains multiple instances of the same value, you can group these identical values together.
Grouping and ungrouping may change the order of the report items. Sections must precede grouped columns, and grouped columns must precede ungrouped columns.
Grouping reorders the rows of a selected report item so that identical values appear together and suppresses the display of duplicates.
Each group shows footer values for report items that have footer summarization turned on.

Creating sections shows the value of a selected report item as the heading of a section.
If you create a chart for a report that is grouped in section headings, one chart appears for each section.

You cannot group measures. You can group only report items containing text data or non-measure numeric data, such as order numbers.
Open the report that you want in Query Studio.
Click the heading of the report item you want to group by.
Choose how you want to group:
To group, click the group button  on the toolbar.
The report suppresses duplicate values of the selected report item and lists the values in each group.
To create sections, click the create sections button  on the toolbar.
To ungroup or to remove sections, click
the original item heading or section heading and then click the
ungroup button  on the toolbar.
To remove the subtotals in a grouped report, click the summarize
button  on the toolbar, and then, in the Summary
for footers box, click None.
To change a sectioned report to a crosstab, click the original
item heading and then click the pivot button  on the toolbar.
