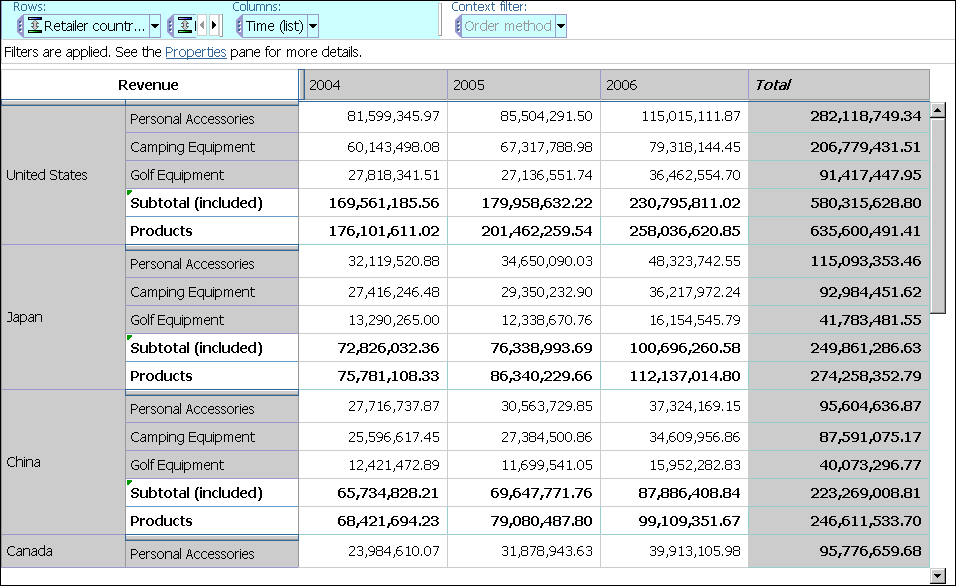
Example - Find Your Top or Bottom Performers
You can find your most profitable markets.
In this topic, you learn how to find the top three products within
each of the top five markets by revenue. The items returned for
each of the top counts change when you change the default measure
or add a context filter.
You want to know the answers to these questions:
What are the top five markets by revenue?
What are the top three products in each of the top five markets?
What is the effect of changing the measure or filter criteria?
If you need more help, see Insert All the Items of a Level, Limit Data to Top or Bottom Values,
and Filter Values Using Context.
Steps
Create a new analysis using the Sales and Marketing
(cube) package.
Add the following items to the crosstab:
Revenue as the default
measure
all the items in the Retailer country level
(in Retailers) in the rows
Products as nested rows
2004, 2005, and 2006 (in Time)
in the columns
Apply a top 5 rule for Retailers.
Apply a top 3 rule for Products.
Add Order Method as a context filter.
See what happens to the top performers when you filter the crosstab
using different order methods or when you change the default measure.


